Croydon Development Finance 2026: Town-Centre Regen, Capital Stack & Sold Prices
Croydon is up 2.5% year on year to February 2026. Greater London is down 3.3%. That is roughly six percentage points of relative outperformance applied to the largest residential market in south London by population, with the largest consented mid-rise pipeline in outer south London, and one of the busiest commuter interchanges in the south-east at the centre of it. The headline number is smaller than Walthamstow’s +5.9% or Redbridge’s +5.3%. The absolute scale of what the number applies to is not.
This piece is the operator-level read on why Croydon is the size-and-transport story in 2026, what the £650 per square foot viability line means inside the borough, what lenders are actually pricing on Croydon schemes today, and how the capital stack works on a town-centre scheme at the GDV scales Croydon can absorb that most outer-south boroughs cannot.
Why Croydon is the size-and-transport story — town-centre regen as the engine
Croydon is the most populous London borough. The town centre and the East Croydon station area have, on the consented mid-rise side, more units per square mile of brownfield than anywhere else in outer south London. That is a structural fact and it is what makes the +2.5% headline meaningful in a way the same number would not be in a smaller borough.
The borough has had a bruising decade on the institutional regeneration side. The Westfield/Hammerson Whitgift Centre redevelopment was paused, restructured, and is still being repositioned. Specific town-centre schemes have come in and out of credible delivery. The council itself worked through serious financial constraints. Reading the public commentary you would conclude Croydon is a problem borough. Reading the residential transactions and the consented mid-rise pipeline you conclude something else: the underlying urban fabric, the transport anchor and the planning environment now support a credible 2026 story even after a decade of public-side noise.
The transport anchor is decisive. East Croydon is one of the busiest interchanges in the south-east. Thameslink to London Bridge in eight minutes. Direct Southern services into Victoria. Gatwick Express. Tramlink network across south-west London. Multiple schemes in the East Croydon and Wellesley Road corridor sit inside a ten-minute walk of all of that. The catchment quality available at Croydon town-centre price points is not available at Croydon town-centre price points anywhere else in south London.
Outside the town centre, Croydon is large and varied. Sub-Croydon postcodes — parts of Thornton Heath, Selhurst, Norbury, the southern fringes towards Coulsdon and Purley — have very different valuation dynamics. Some clear viability comfortably. Some sit at or below the line. The town-centre versus outer-borough distinction is, like Bromley’s similar trajectory at +3.0% YoY, binary rather than a sliding scale.
Reading the +2.5% in context
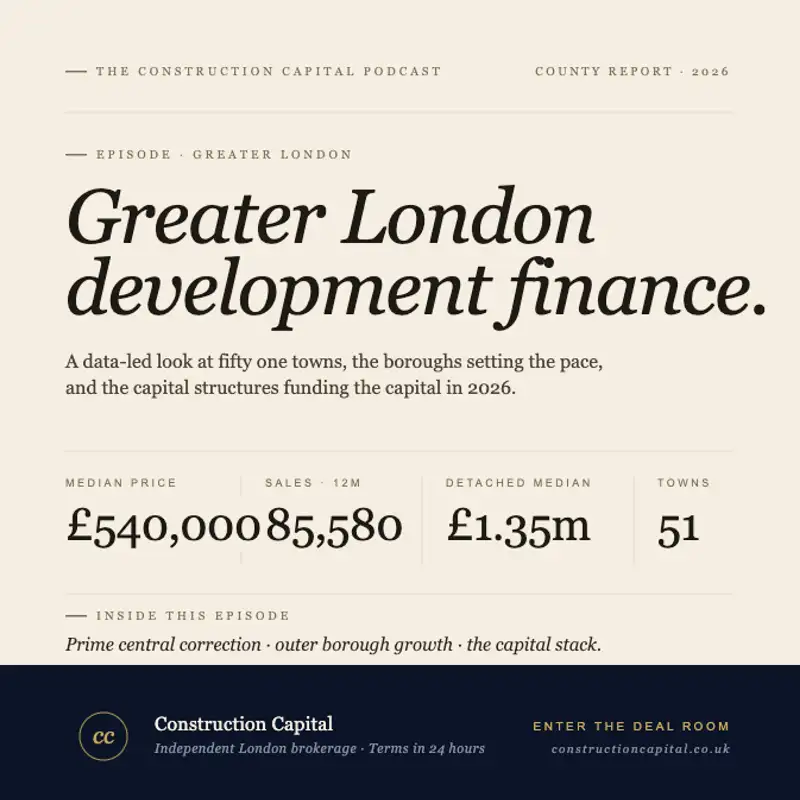
Across the 51 principal Greater London towns the median sat at £540,000 over 85,580 transactions in the rolling twelve months to February 2026. New-build completions came in at just 1.9% of total activity. Against that backdrop, Croydon’s +2.5% reflects three distinct things at once.
First, demand depth. Croydon catchment buyers are pricing in transport, schools and family-stock availability that, at Croydon’s GDV per square foot, are simply not available in inner south London any more. The migration showing up in Bromley’s town centre is showing up in Croydon at higher unit volumes because the borough’s resi base is bigger.
Second, supply absorption. Croydon’s town-centre pipeline has actually been delivering — measured releases of mid-rise resi over multiple years. The institutional BTR side is more recent and more concentrated. The combination of build-to-sell mid-rise releasing in tranches plus institutional forward-funded BTR slotting in at the higher end has kept absorption credible without saturating any single phase.
Third, the £650 per square foot viability test. Of the 281,000 unbuilt consented homes across Greater London, only 119,200 sit above the threshold Molior identifies as the binary line between viable and undeliverable on current build cost and finance economics. Croydon town-centre consents are a disproportionately large share of the south-London side of that 119,200 — both because the borough has a large consented pipeline and because the mid-rise delivery model in the town centre has been built around values that clear the threshold by £50 to £150 per square foot. By contrast, Kensington and Chelsea is down 11.2% and Westminster 10.8% over the same window, and even at twelve hundred pounds per square foot those falls are eating margin headroom across consented prime stock without re-pricing the land basis. Croydon is in the opposite position: lower per-square-foot values, but values that are moving the right way at the right scale.
What lenders are pricing on Croydon schemes in 2026
Following the Bank of England’s December 2025 cut to 3.75%, Croydon-town-centre senior debt is in the tightest band since 2022. The full April 2026 capital stack is in the table above. Three layers are doing most of the work.
Senior development finance is available from 6.5% per annum at 65 to 70% LTGDV for an experienced developer with credible cost certainty on a town-centre resi-led scheme. Stretched senior products start around 7.5% and reach 75% LTGDV where the cost plan and contractor are bankable and where a forward fund is in place. Mezzanine finance starts at 12% per annum and stretches gearing to 85 to 90% of cost. Bridging on auction acquisitions and pre-planning land assembly is from 0.55% per month at up to 75% LTV.
What materially differentiates Croydon from most outer south boroughs is BTR forward-funding appetite. East Croydon’s transport position and the rental comparables built up over the last cycle support institutional take-out conversations at 5.75% net yields on the right scheme. Forward-funded BTR removes take-out risk from the underwriting which compresses senior pricing on the construction layer too. Several Croydon schemes that pencilled marginally on a build-to-sell appraisal pencil cleanly with a forward-fund executed at exchange. Bromley sees less BTR forward funding than Croydon and more PBSA depth; Croydon’s catchment is more institutional-rental-friendly.
For the right Croydon town-centre scheme with a credible forward fund, blended all-in pricing now lands in the 6.5% to 8.5% range. That is the operative number when running a Croydon viability appraisal in this rate environment. It is meaningfully tighter than the same scheme would have priced in 2023 or 2024.
What is actually transacting in Croydon
Three categories of scheme are running across Croydon in 2026.
Town-centre intensification on resi-led brownfield. Typically 8 to 20 storeys, 100 to 400 homes, in the East Croydon and Wellesley Road corridor and adjacent regen areas. These are the schemes clearing fastest under the Time-Limited Planning Route at 20% affordable housing by habitable room. Several of these are forward-funded BTR or BTR-to-buy hybrids; absorption on the build-to-sell phases is supported by transport and catchment more than by any single demand event.
Institutional BTR forward funds in the East Croydon corridor. The unit-count scale Croydon supports — 250 to 600 unit single schemes — is well above what most outer-south boroughs can offer institutional capital on a single ticket. That scale advantage is the reason BTR is concentrating here rather than further out.
Suburban density-uplift schemes outside the town centre. Typically 6 to 50 home town-house and apartment schemes in the stronger Croydon catchments. These are senior-debt-financeable for established developers without needing mezzanine in most cases, but the £650 viability test is binary and many sub-Croydon postcodes do not clear it on current values.
How the capital stack works on a £25m GDV Croydon scheme
A typical East Croydon corridor mid-rise scheme at this scale, with strong PTAL within a 10-minute walk of East Croydon station, a clean planning consent under the new NPPF regime, and a credible forward-fund interest from an institutional BTR buyer, can be financed with senior development finance at 65% to 70% LTGDV at around 6.5% to 7.5%, mezzanine layered to 90% of cost at 12% plus, and a manageable equity or JV equity component to close the gap. Total senior plus mezz cost-of-funds typically blends in the high sevens.
On a larger scheme — and Croydon supports £40m to £120m GDV town-centre schemes that simply do not exist in most outer south boroughs — the institutional senior pool re-engages, multiple mezzanine providers compete for allocation, and the forward-funded BTR conversation moves from optional to underwriting-defining. That is the structural window the next twelve to eighteen months represent for Croydon town-centre development capital specifically. Compare to a sub-Croydon site sitting on a £600 per square foot residual: the senior layer prices 50 to 100 basis points higher and the mezzanine appetite thins materially. That spread is now the operative input on every Croydon site appraisal.
What this means for Croydon site acquisition
If you are pricing land in Croydon in 2026, three things matter more than they have in any recent cycle.
One, the East Croydon corridor versus outer-Croydon distinction is binary, not a sliding scale. A site within a 10-minute walk of East Croydon with a credible 8 to 20 storey resi-led play, ideally with a BTR-friendly unit mix, will clear viability and attract competitive senior debt and a forward-fund conversation. A site in the southern or eastern fringes of the borough with the same residual price per square foot will not.
Two, the £650 per square foot test is being applied at term-sheet stage on the GDV input row. Lenders are not negotiating it. A Croydon scheme that does not clear it on credible market comparables is being declined before structuring.
Three, BTR forward-funding optionality is the Croydon-specific multiplier. The same scheme that prices marginally on build-to-sell often prices cleanly with an institutional forward fund. Designing a Croydon mid-rise to be BTR-deliverable from the masterplan stage is now worth real basis points on the senior layer and real margin on the residual land bid.
For full borough-by-borough sold price data, the East Croydon pipeline references, viability modelling and the underlying capital stack benchmarks behind this analysis, see the Greater London Property Market Report 2026. Borough-specific intelligence sits on the Croydon location page.
See also: Walthamstow +5.9% on YouTube and The £650/sq ft Cliff on YouTube.
Listen to the full episode
For the dedicated deep dive on this borough, we have published a stand-alone Croydon episode of the Construction Capital podcast: Croydon +2.5%: The Transport and Scale Story in Outer South London. Around ten minutes covering the East Croydon transport thesis, the £650 per square foot viability test as it falls inside Croydon, the full April 2026 capital stack, BTR forward-funding pricing, and what is actually transacting in 2026.
This article also draws on Episode 2 of the Construction Capital podcast: Greater London Property Development Finance 2026: Market Analysis, House Prices and Lending Outlook. The full borough-level data, policy detail and capital stack discussion runs 15:30, with chapters covering Croydon, Bromley and Walthamstow within the wider Greater London outlook.
Listen anywhere
Listen on Apple Podcasts, Spotify, Overcast, Pocket Casts, or Amazon Music.
For indicative terms on a Croydon scheme within 24 hours, submit through the Construction Capital deal room.
Published by Construction Capital, an independent capital advisory brokerage sourcing terms from over 100 lenders across development finance, bridging, mezzanine, and equity. This article is part of a 20-piece Greater London 2026 series accompanying the Construction Capital podcast.